Compare events
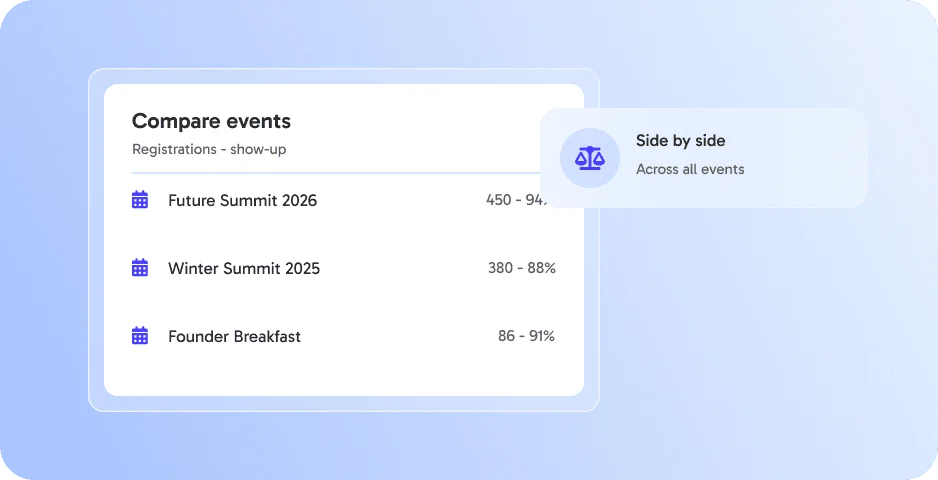
See registrations, attendance and no-shows side by side. 👉 Identify patterns.


See registrations, attendance and no-shows side by side. 👉 Identify patterns.
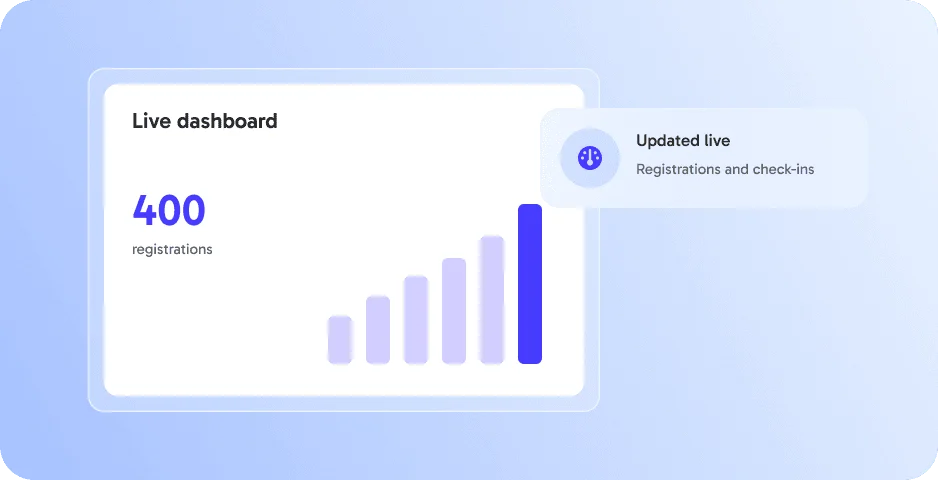
Monitor live event data such as registrations, check-ins, and no-shows as they happen. 👉 Stay in control and make smarter on-site decisions.
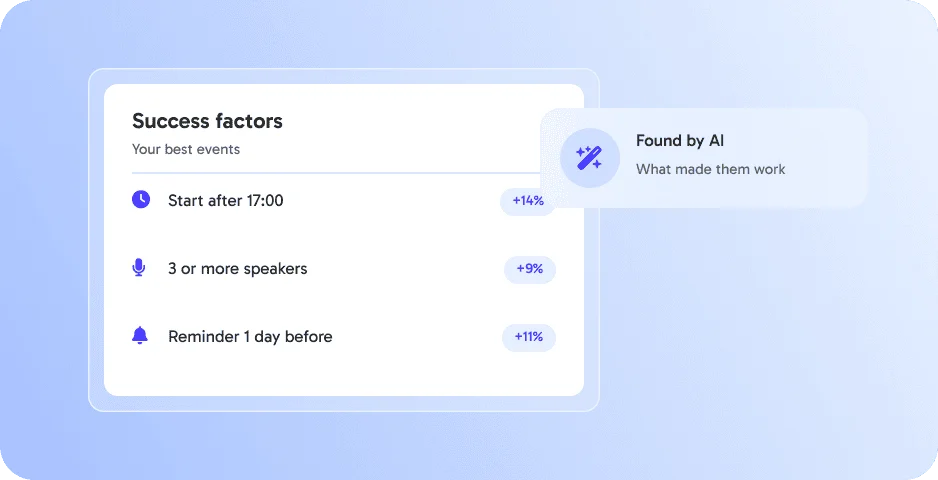
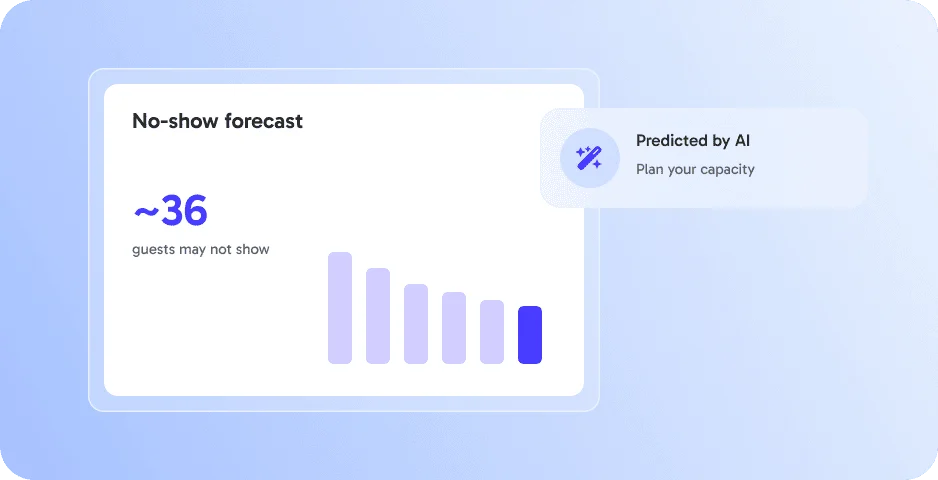
Use AI to predict no-shows, spot engagement trends, and segment guests automatically. 👉 Anticipate challenges before they happen.
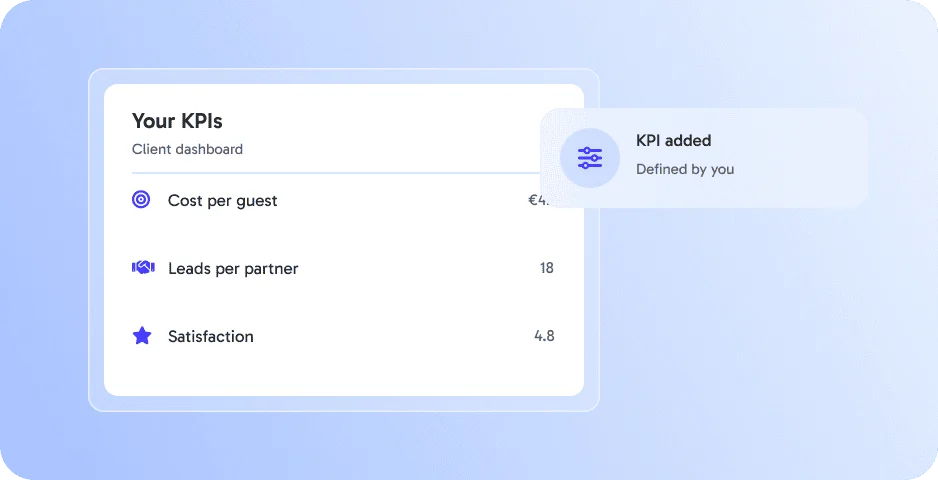
Build tailored dashboards, define your own KPIs, and connect data to BI tools via API. 👉 Create the insights your clients care about most.
Cross-Event Analytics works best together with these features - all in one platform, without extra tools.
Cross-Event Analytics in eventpage.ai compares the results of several events over time.
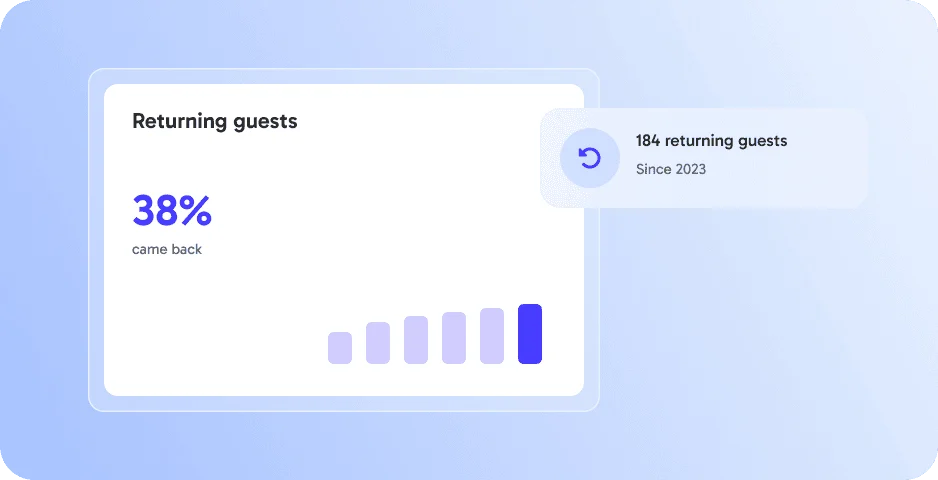
For example registrations, attendance, no-shows and returning guests.
Event series, agencies and marketing teams running many events.
Export & Reporting will make it easy to share results.
By submitting the form, I confirm that I have read the privacy policy and agree to the processing of my personal data by eventpage.ai for the stated purposes. In case of consent, I can revoke my agreement at any time.